

 Performance counters give immediate insights into your system’s critical metrics. They help you spot and fix bottlenecks before they affect your operations.
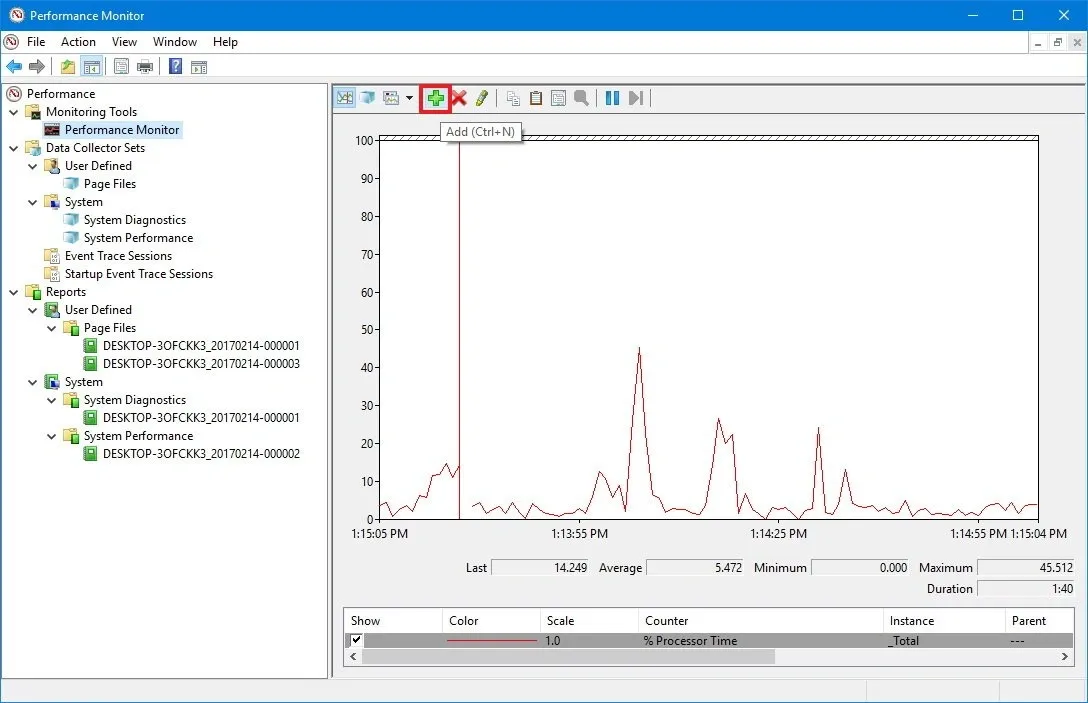
Windows Performance Monitor is a powerful diagnostic tool that system administrators use to track CPU usage, memory use, and hundreds of different performance metrics. The tool displays the %Processor Time counter by default, but its real strength comes from capturing performance data over specific periods . System administrators can detect suspicious behavior, unauthorized access attempts, and potential security vulnerabilities by analyzing network traffic and system logs .
Windows performance counters are a great way for IT professionals to ensure systems have enough resources. These professionals can be proactive about bottlenecks, perform root-cause analysis, and troubleshoot issues . Users can also monitor their PC’s performance during specific activities and track remote computers’ performance immediately .
This complete guide will show you how to become skilled at Windows Performance Monitor. You’ll learn to use its interface, employ its immediate monitoring features, create custom data collector sets, and analyze performance reports effectively.
Getting Started with Windows Performance Monitor
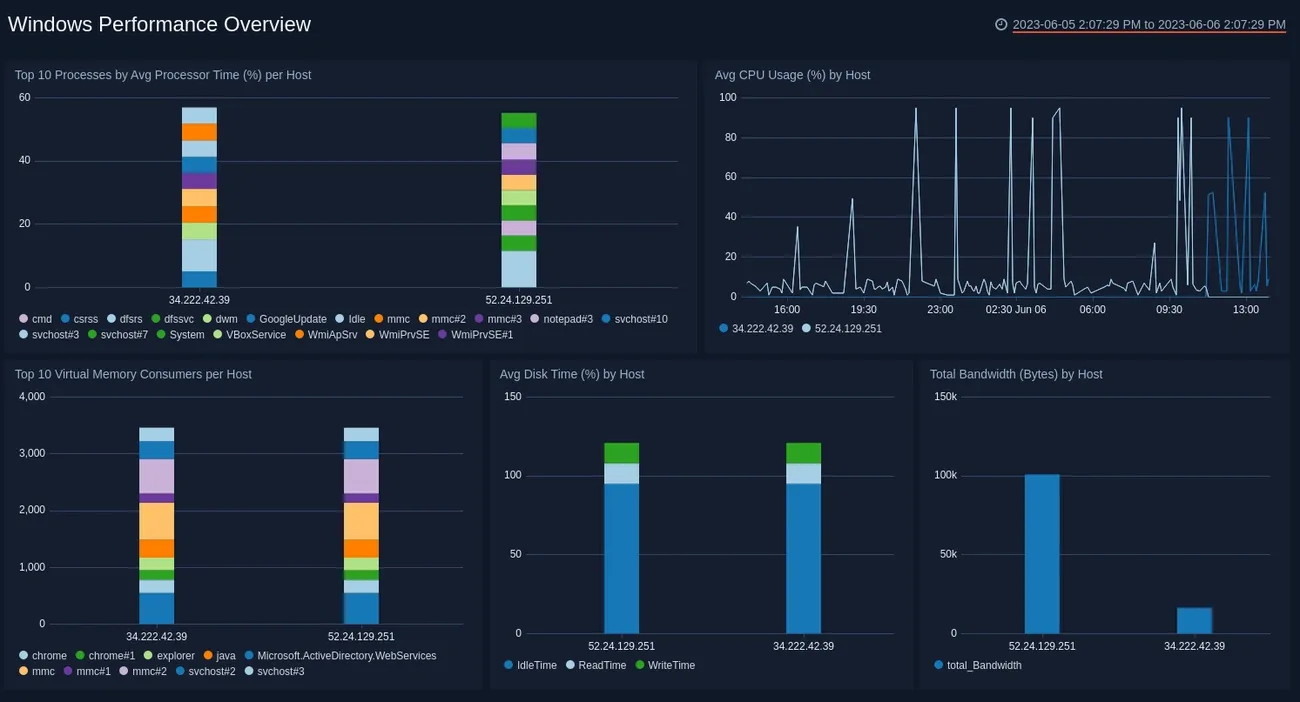
Image Source: Sumo Logic Documentation
Windows Performance Monitor is one of the most powerful diagnostic tools that many users overlook since Windows NT 3.1 [1]. This built-in tool gives detailed insights about your system’s operational metrics and helps spot potential bottlenecks.
What is Performance Monitor in Windows?
Performance Monitor (PerfMon) is a strong system monitoring program that tracks your computer’s activities like CPU usage, memory consumption, disk activity, and network traffic [2]. It acts as a high-level abstraction layer with a consistent interface that collects different types of system data [3].
System administrators watch performance counters to detect unusual behavior or performance issues. Software developers check these counters to examine their components’ resource usage [3]. The Windows Performance Monitor displays information through graphs, bar charts, or lists of numeric values. These values update at different time intervals [1].
How to launch and guide the interface
You can start Performance Monitor in several ways:
-
Type perfmon in the Run dialog box (Windows + R) [4]
-
Search for “performance monitor” in the Windows search box [4]
-
Execute perfmon.exe in Command Prompt or PowerShell [4]
-
Access it through Computer Management under System Tools [4]
-
Use specific command-line options like perfmon /sys to open it in standalone mode [4]
The interface shows a hierarchical structure after launch. “Performance” sits at the top level and shows your system’s memory, network, and disk usage overview [5]. Right-clicking on “Performance” lets you connect to another computer to monitor remote systems [5].
Understanding the default view and counters
Performance Monitor starts with a single counter: the %Processor Time counter [5]. This counter checks CPU utilization but shows just a small part of PerfMon’s capabilities [6].
Performance Monitor excels at capturing performance metrics over time. These metrics reveal trends that determine your system’s overall performance [5]. A counterset groups performance data within a provider and contains one or more counters [3]. Each counter represents a single piece of performance data with its own name and type [3].
Click the green plus sign or right-click in the graph area to add more counters [7]. This lets you track any metrics immediately, from memory utilization to disk latency [6].
Using Real-Time Monitoring Tools
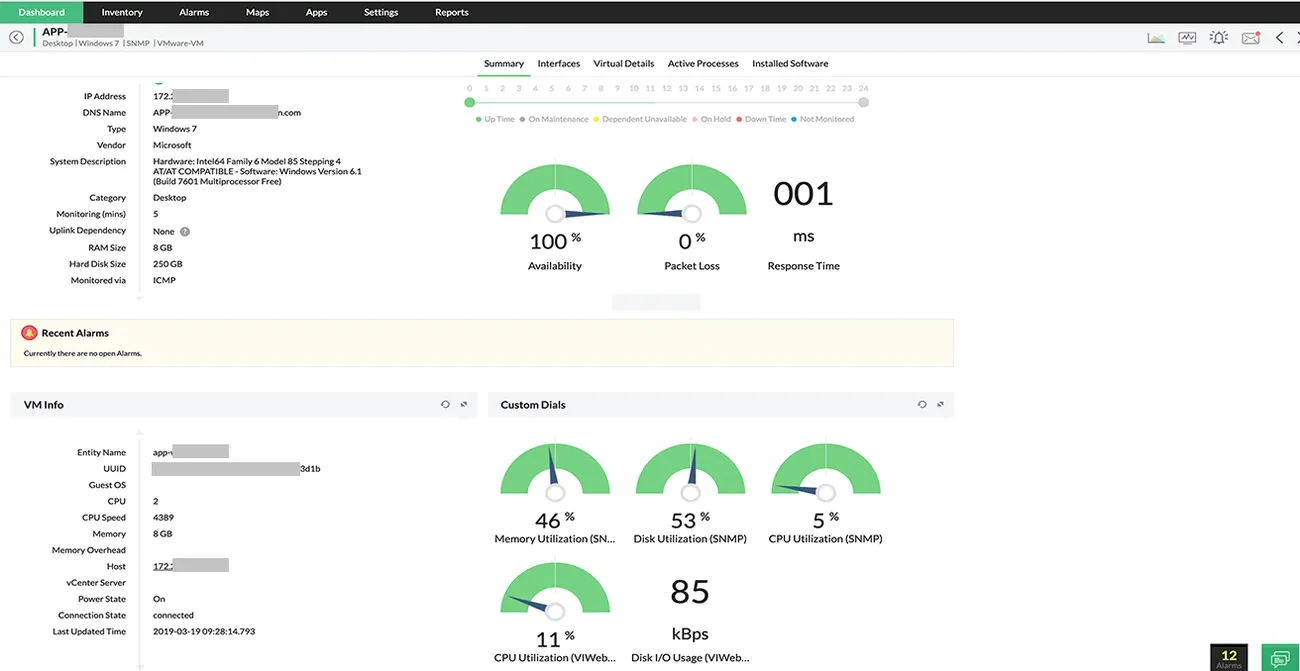
Image Source: ManageEngine
Live monitoring shows how your system performs instantly. Performance Monitor becomes a vital tool that helps you troubleshoot and optimize when configured properly.
Adding and removing performance counters
You can unlock Performance Monitor’s true potential by customizing it with relevant counters. The green plus icon in the toolbar lets you add counters. Select categories like PhysicalDisk, Memory, or Processor from the “Available counters” list. Pick specific counters and instances, then click “Add” [8].
These counters are the foundations of good monitoring:
-
Processor: %Processor Time, %User Time, %Privileged Time
-
Memory: Available MBytes, % Committed Bytes in Use
-
Disk: Current Disk Queue Length, Disk Read/Write Bytes/sec
-
Network: Network I/O, Network Utilization
You can remove counters by right-clicking the unwanted one in the display pane and selecting “Remove” or highlighting it and pressing Delete.
Tracking CPU, memory, disk, and network usage
CPU monitoring spots processing bottlenecks quickly. Your system might need hardware upgrades if processor utilization stays at 80-90% consistently [9]. Systems with multiple processors need individual monitoring, or you can use System: %Total Processor Time to see the average.
Memory monitoring shows how RAM gets used. Memory leaks often show up as increasing Private Bytes and Virtual Bytes counters [10]. Physical memory might be insufficient when Hard Faults/sec values run high.
Disk monitoring identifies storage bottlenecks effectively. High disk latency problems become visible through Disk Queue Length and Disk sec/Transfer metrics [11]. Network monitoring tracks bandwidth usage through Network I/O counters [12].
Using Resource Monitor and Reliability Monitor
Resource Monitor gives you a detailed look at system activity live. Type “resmon” in Run dialog or access it from Performance Monitor’s Overview tab [13]. The easy-to-use interface shows detailed information about CPU, memory, disk, and network resources with interactive graphs.
Reliability Monitor tracks system stability over time using a 1-10 scale rating [14]. You can access it by typing “perfmon /rel” in Run dialog or searching for “reliability” in Settings. System events fall into three categories: errors (crashes), warnings (non-critical issues), or information (successful updates).
Creating and Managing Data Collector Sets
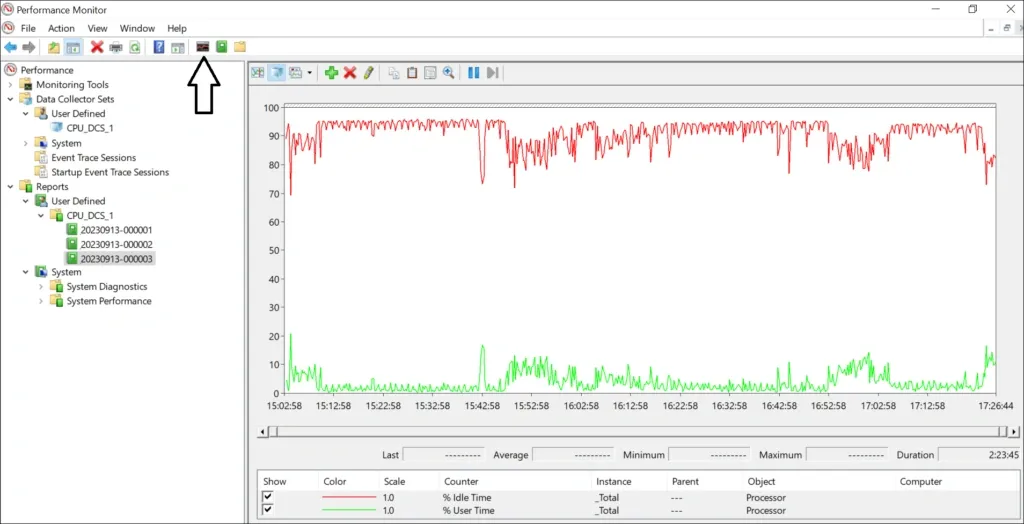
Image Source: PerfMatrix
Data collector sets are the foundations of performance metric capture over time. Administrators can analyze system behavior beyond immediate monitoring. These collections of data points help track performance patterns and identify intermittent issues that might go unnoticed.
Types of data collector sets: counter, trace, config
Windows Performance Monitor provides three main types of data collector sets that serve distinct monitoring purposes [5]:
-
Performance Counter data collectors capture metrics through polling at specified intervals and work best to track resource usage
-
Event Trace data collectors log events as they happen instead of fixed intervals and give detailed transaction information
-
System Configuration data collectors gather registry information and system settings to diagnose problems
Steps to create a custom data collector set
You can create a custom data collector set by following these steps [1]:
-
Open Performance Monitor by typing “perfmon” in the search box
-
Expand Data Collector Sets in the navigation tree
-
Right-click on User Defined and select New > Data Collector Set
-
Enter a descriptive name and select Create Manually (Advanced)
-
Select the data collection types you need (performance counter, event trace, system configuration)
-
Add relevant performance counters by clicking Add and selecting from available options
Setting counter intervals and choosing metrics
The sampling interval determines how often the system collects data points. Short intervals give more detailed data but use more resources [1]. Long intervals work better for occasional issues, while shorter ones help with immediate troubleshooting.
Your monitoring goals should guide metric selection. Key metrics typically include CPU utilization, memory usage, disk activity, and network performance [2].
Saving and scheduling data collection
Choose a root directory to store your collected data [15]. This setup lets you view reports through Performance Monitor later.
The scheduling feature automates data collection. Right-click your data collector set to access these options [16]. You can set start times, durations, and stop conditions. The collector can run at specific times or after system startup to catch recurring issues [16].
Analyzing Reports and Setting Alerts
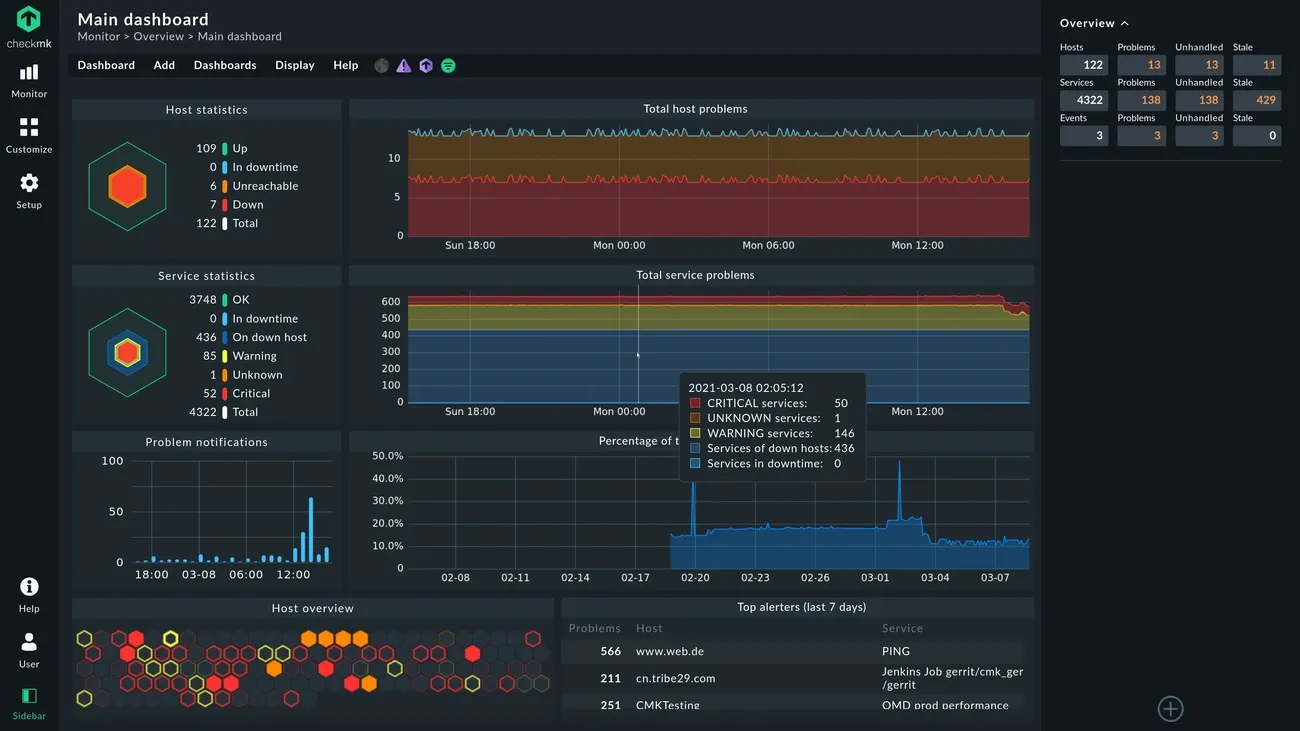
Image Source: Sematext
Raw data becomes useful insights once you analyze reports and set up alerts after collecting performance data through data collector sets.
Accessing and interpreting performance reports
Performance Monitor stores reports in the “Reports” section of the navigation tree. You can find your collected data by expanding “User Defined” and selecting your data collector set [17]. These reports are a great way to get different views of your data through line graphs that track trends, histograms showing data distribution, and detailed textual summaries [18].
The system lets you customize specific counters. Just right-click any counter and select “Properties” to change its appearance with different colors, scales, and line widths [19]. Complex graphs become easier to read when you use the “Highlight” button to focus on individual counters [19].
Creating performance counter alerts
Here’s how to set up performance counter alerts:
-
Right-click your data collector set and select “New” > “Data Collector”
-
Choose a name and select “Performance counter alert” [4]
-
Add the counters you want to monitor and set threshold conditions
-
Set your alert triggers (e.g., CPU above 90%) [4]
-
Add extra actions that happen when thresholds are crossed
Best practices for threshold configuration
Good threshold configuration needs balance between being responsive and avoiding too many alerts. Alert fatigue becomes less of an issue when you group alerts by urgency levels [20]. Critical systems need backup notification methods beyond email, like SMS alerts [20].
Your thresholds should match your performance baselines instead of random values [21]. The right rearm values prevent alerts from bouncing back and forth when metrics hover near threshold limits [22].
Conclusion
Windows Performance Monitor is a crucial tool that helps system administrators and IT professionals maintain optimal system performance. Its immediate monitoring features let users learn about CPU usage, memory utilization, disk activity, and network traffic. Becoming skilled at using this powerful utility helps identify performance bottlenecks before they affect critical operations.
The system’s ability to create custom data collector sets offers flexibility to track specific metrics over time. This feature becomes especially valuable when you have intermittent problems that spot checks might miss. System administrators can set performance baselines and detect deviations from normal operational patterns quickly.
Performance Monitor goes beyond simple monitoring with strong reporting and alerting features that turn raw data into applicable information. The system notifies administrators about potential problems automatically once thresholds are set. This allows quick intervention before users experience any performance issues.
Windows Performance Monitor has been one of the most powerful diagnostic tools since Windows NT 3.1, though many overlook it. Users who understand its easy-to-use interface, employ immediate monitoring tools, create proper data collector sets, and analyze performance reports can maintain peak system performance effectively. Without doubt, time spent learning this built-in utility leads to improved system reliability, better troubleshooting capabilities, and optimized resource use.
Key Takeaways
Master Windows Performance Monitor to proactively identify system bottlenecks and optimize performance before issues impact your operations.
• Launch PerfMon easily: Type “perfmon” in Run dialog or search “performance monitor” to access this powerful built-in diagnostic tool.
• Focus on essential counters: Monitor CPU %Processor Time, Memory Available MBytes, Disk Queue Length, and Network I/O for comprehensive system insights.
• Create custom data collector sets: Set up automated performance tracking with appropriate sampling intervals to capture intermittent issues over time.
• Configure smart alerts: Set meaningful thresholds based on performance baselines rather than arbitrary values to avoid alert fatigue.
• Use complementary tools: Leverage Resource Monitor (resmon) for detailed real-time views and Reliability Monitor for system stability tracking.
Performance Monitor transforms from a simple CPU tracker into a comprehensive diagnostic powerhouse when properly configured. The key lies in customizing counters, establishing baselines, and creating automated collection processes that provide actionable intelligence for maintaining optimal system performance.
FAQs
Q1. How do I access Windows Performance Monitor? You can launch Performance Monitor by typing “perfmon” in the Run dialog box, searching for “performance monitor” in the Windows search box, or executing “perfmon.exe” in Command Prompt or PowerShell.
Q2. What are the essential performance counters to monitor? Key counters include CPU %Processor Time, Memory Available MBytes, Disk Queue Length, and Network I/O. These provide comprehensive insights into your system’s CPU, memory, disk, and network performance.
Q3. How can I create a custom data collector set? To create a custom data collector set, open Performance Monitor, expand Data Collector Sets, right-click on User Defined, select New > Data Collector Set, name it, choose Create Manually (Advanced), select data collection types, and add relevant performance counters.
Q4. What’s the best way to set up performance alerts? Create performance counter alerts by right-clicking your data collector set, selecting New > Data Collector, choosing Performance counter alert, adding specific counters to monitor, and defining threshold conditions. Set meaningful thresholds based on performance baselines to avoid alert fatigue.
Q5. How can I interpret performance reports in Windows Performance Monitor? Access reports under the “Reports” section in the navigation tree. You can view data as line graphs for tracking trends, histograms for data distribution, or comprehensive textual summaries. Right-click on counters to modify their appearance for better visibility and use the “Highlight” button to isolate individual counters in complex graphs.
References
[1] – https://docs.iconics.com/V10.96/GENESIS64/Help/Com/Intro/Setting_up_Windows_Performance_Monitor.htm
[2] – https://help.tableau.com/current/server/en-us/perf_collect_perfmon.htm
[3] – https://learn.microsoft.com/en-us/windows/win32/perfctrs/about-performance-counters
[4] – https://www.mssqltips.com/tutorial/create-windows-performance-monitor-counter-alert-from-data-collector/
[5] – https://www.sciencedirect.com/topics/computer-science/data-collector-set
[6] – https://www.sqlskills.com/blogs/erin/customizing-the-default-counters-for-performance-monitor/
[7] – https://sematext.com/glossary/windows-performance-counters/
[8] – https://learn.microsoft.com/en-us/windows/win32/perfctrs/deleting-performance-counters
[9] – https://learn.microsoft.com/en-us/sql/relational-databases/performance-monitor/monitor-cpu-usage?view=sql-server-ver17
[10] – https://learn.microsoft.com/en-us/windows-hardware/drivers/debugger/using-performance-monitor-to-find-a-user-mode-memory-leak
[11] – https://community.qlik.com/t5/Official-Support-Articles/How-to-log-CPU-Disk-and-memory-usage-with-Microsoft-Performance/ta-p/1712237
[12] – https://www.nettigritty.com/kb/windows/bandwidth-monitoring-tools-for-windows/
[13] – https://techcommunity.microsoft.com/blog/askperf/using-resource-monitor-to-troubleshoot-windows-performance-issues-part-1/375008
[14] – https://www.ninjaone.com/blog/view-reliability-history-in-windows/
[15] – https://learn.microsoft.com/en-us/dynamics365/business-central/dev-itpro/administration/monitor-use-performance-monitor-collect-event-trace-data
[16] – https://www.mssqltips.com/tutorial/schedule-data-collection-with-windows-performance-monitor/
[17] – https://techcommunity.microsoft.com/blog/askperf/windows-performance-monitor-overview/375481
[18] – https://www.lenovo.com/us/en/glossary/what-is-performance-monitor/?srsltid=AfmBOoor5Jt8ep7yw6zXkBY_SKsZtdPoku6pMMfJCC_5bzc-BKDAHo_0
[19] – https://www.mssqltips.com/tutorial/analyze-windows-performance-monitor-counters-using-perfmon/
[20] – https://blog.paessler.com/best-practices-for-monitoring-and-alerting-that-ensure-it-systems-operate-reliably
[21] – https://www.ibm.com/think/topics/application-monitoring-best-practices
[22] – https://www.manageengine.com/network-monitoring/help/configure-thresholds.html